Can You Predict an Airbnb Listing’s Popularity Before It Ever Hosts a Guest?
· CPSC 330 · Python, scikit-learn, LightGBM
One of Airbnb’s major problems is figuring out whether a listing will take off or just sit there ignored. My project for CPSC 330 was to try to predict that: given everything we know about a New York City Airbnb listing (its price, location, room type), can a model predict how popular that listing would be? Since Airbnb doesn’t make booking data public, reviews_per_month is the closest available factor to a listing’s popularity, and if we have a model that can predict it well, it would help hosts understand what’s working against them before they post a listing.
The data
I used the public New York City Airbnb Open Data set on Kaggle, roughly 48,900 listings scraped in 2019. It includes columns like price, room type, minimum nights, location, and host listing count. The first surprise in EDA: about one in five listings (10,052 of them) have no value for reviews_per_month. The reason for that is that they have zero reviews. I dropped those rows, leaving roughly 38,800 listings for a 70/30 train/test split.
The target is right-skewed, meaning most listings get under one review a month, and only a long tail gets more, as Figure 1 shows.
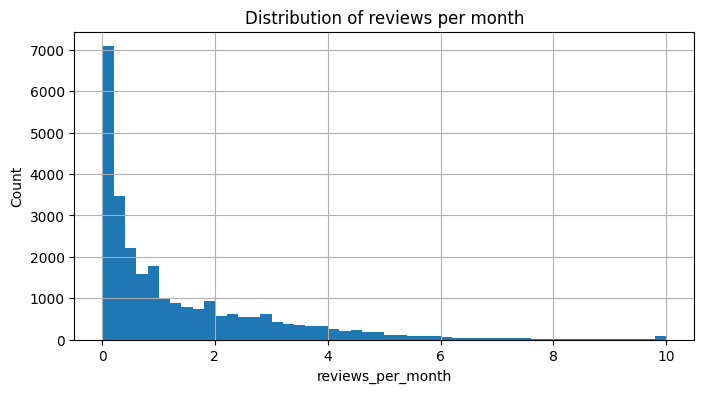
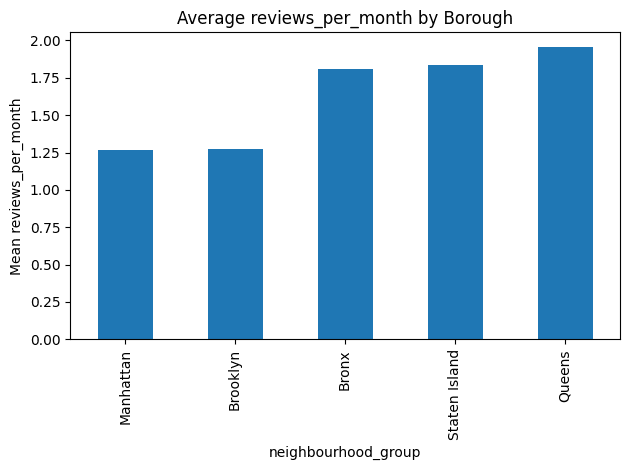
The skew matters because RMSE ends up being dominated by how well the model handles low-activity listings rather than the rare hot ones. Another observation is that Manhattan and Brooklyn listings average noticeably fewer reviews per month than Queens, Bronx, or Staten Island listings (Figure 2), even though Manhattan is the most expensive and most-listed borough.
The model
The ColumnTransformer pipeline that I built has the numerical features of price, minimum nights, latitude and longitude, availability, host listing count, plus a couple of engineered review-month and review-year fields. These features were median-imputed and standardized. The categorical features were room type, neighbourhood, borough. They were one-hot encoded. A DummyRegressor predicting the training mean set the floor at an RMSE of 1.70. Ridge regression has the same score 1.70. This can mean that the relationship between these features and popularity is not linear.
Then I compared LightGBM, k-nearest neighbors, and a small random forest. The KNN run never finished. Computing pairwise distances became too slow as the data had hundreds of one-hot-encoded neighbourhood columns, which made me interrupt the model. This led my project to have a two model comparison rather than a three model comparison. LightGBM was the winner of the models I ran. Therefore I tuned it with RandomizedSearchCV over tree depth, number of estimators, learning rate and leaf count. The best cross-validated RMSE of 1.016 was achieved from the ten combinations and three-fold cross-validation of this model.
Results
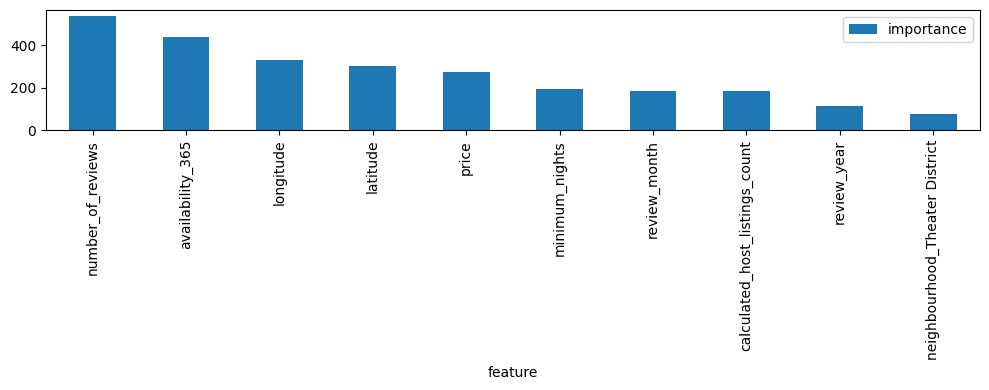
The tuned LightGBM model scored an RMSE of 0.970 on the held-out test set, which is close to its cross-validation score. As we can see, there is a real improvement over the 1.70 dummy baseline. In Figure 3 we can see that number_of_reviews and availability_365 are dominating. After these two we have longitude, latitude, and price as the most effective features. Then the categorical features (ie. room type and specific neighbourhood) matter less compared to the numerical ones.
The answer to the original question (whether you can size up a listing’s popularity from what’s knowable about it) is SOMEWHAT. Mostly by knowing how much it has been booked and reviewed, and then knowing about its price and exactly where in the city it is located.
Caveats
Three things make me less confident in this result than the headline numbers suggest:
- The 20% of the data that I have dropped is not a random part of the data. Those were the listings with zero reviews, the least popular outcomes possible. The model has not seen that part of the listings at all, as the entire tail has been excluded from both test and training data. This means that the model has never scored on the worst performing listings, which affects how good it looks relative to the full population of listings Airbnb actually hosts.
- The most effective feature,
number_of_reviews, is showing us how popular the listing was in the past. This is almost the same information as the target. In this way, a brand new listing would not have this feature, and therefore the model’s strongest signal would suggest that this case is not as popular and would pass on it. - The model comparison that caused me to pick LightGBM was incomplete: KNN never finished a cross-validation fold before I interrupted it, so I can’t claim that LightGBM beats KNN here. To have a more accurate and more fair comparison, I have to run KNN with a more compact neighbourhood encoding, or considerably more compute time, before drawing conclusions about the algorithm family.